Selected work · 10
Copper Hall Effect
Measure a small transverse signal, fit its field dependence, and carry uncertainty through the physics.
Explore the engineering ↓
- My role
- Joint laboratory measurement and analysis
- Status
- 250 K and 300 K measurements documented
- Focus
- Cryogenic transport · regression · uncertainty
Result & scope
Both supplied curves have a negative Hall slope. The report finds electron-dominated conduction and order-of-magnitude agreement with metallic carrier density.
- 01
Prepare
Mount and electrically connect the copper sample.
- 02
Sweep
Hold current and sweep magnetic field through both polarities.
- 03
Fit
Extract the slope of transverse resistance versus field.
- 04
Propagate
Combine slope and thickness uncertainty before interpreting carrier density.
Evidence from the project
Inside the work.
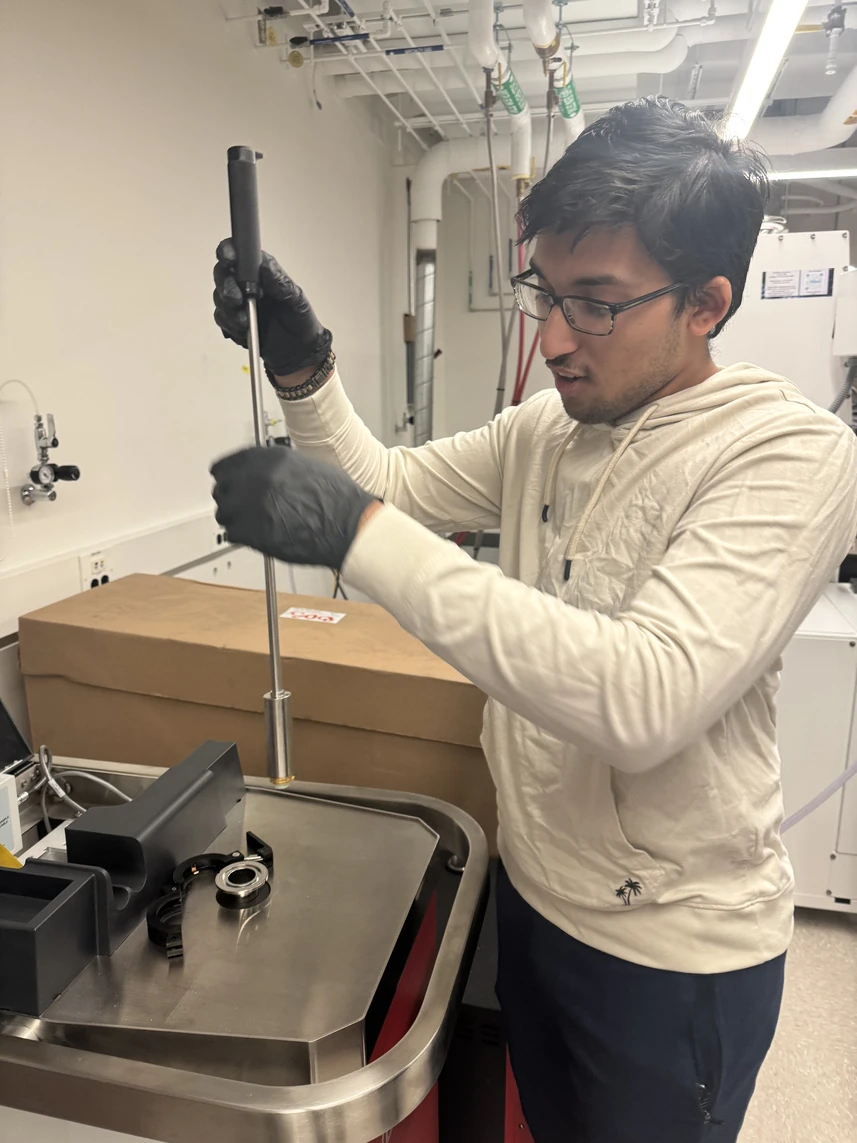
Project photograph of the laboratory setup and sample-handling work.
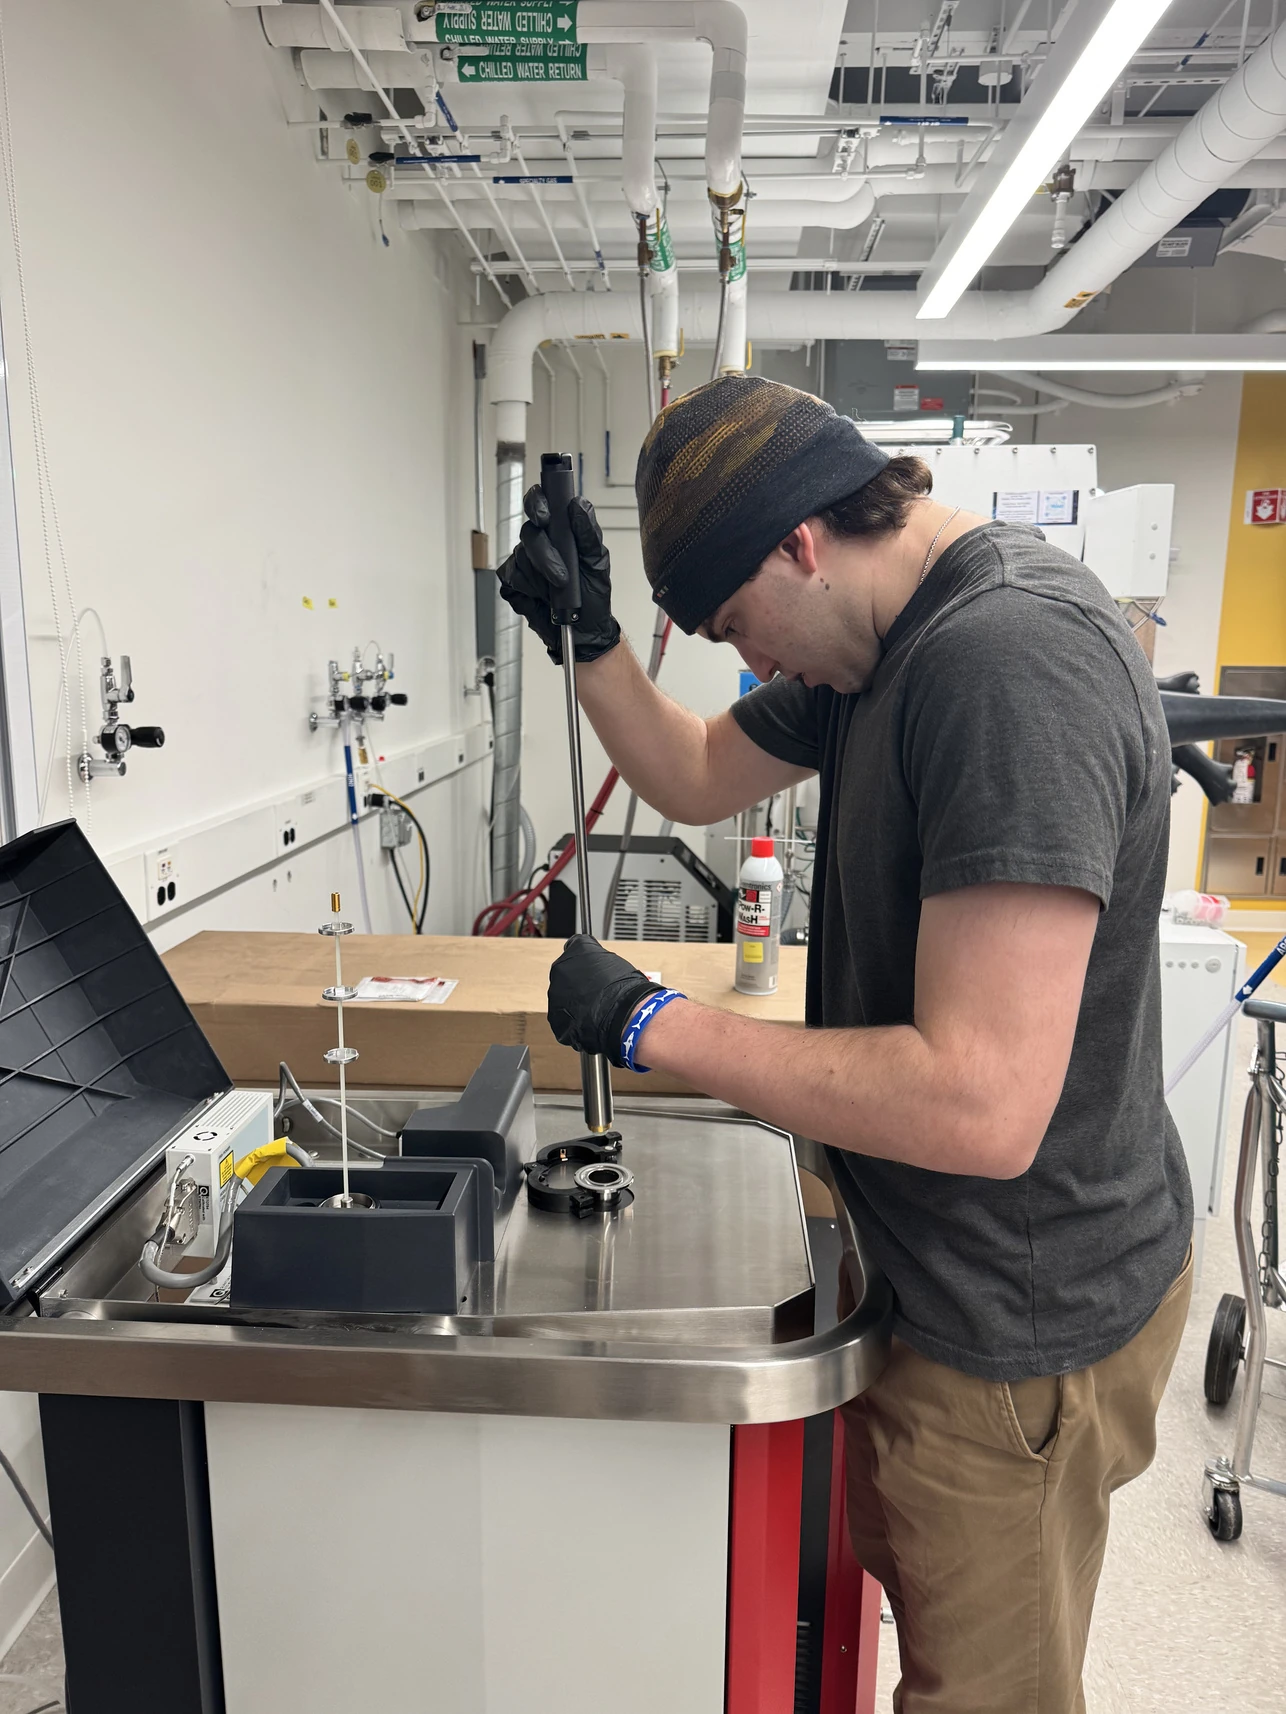
Project photograph of handling work at the apparatus, complementing the instrument setup.
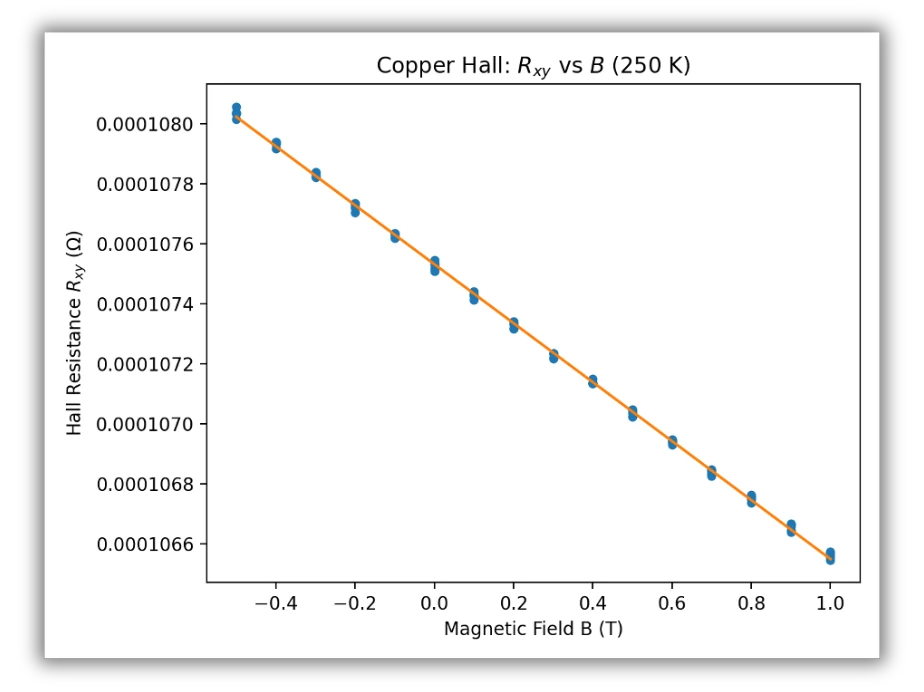
Original negative-slope resistance–field plot from the project presentation.
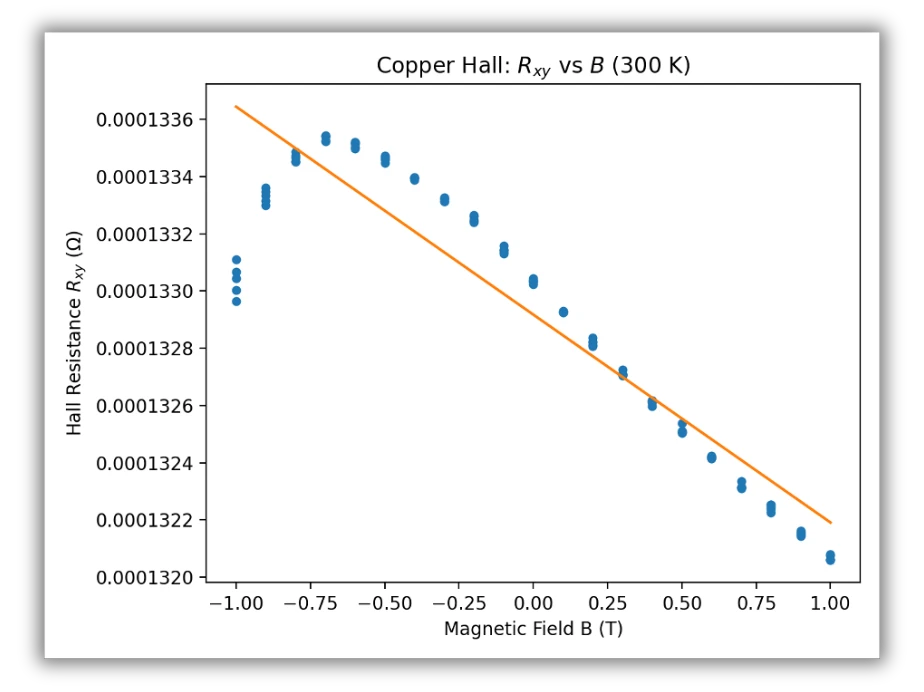
Original plot with greater visible scatter; compare slope and residual structure, not just the fitted line.
Apparatus and sample
The experiment measures transverse resistance in copper at 250 K and 300 K. The presentation records sample dimensions of 12.71 × 10.99 mm, thickness 0.10 mm, and thickness uncertainty ±5 μm. The equipment photos shown here come from the project presentation, not the instructor’s example procedure.
Analysis chain
For a fitted slope m = dRxy/dB and thickness t, the Hall coefficient is RH = t·m. Under the single-carrier approximation, carrier density is n = 1/(|e|·|RH|). The negative slope indicates electron-like Hall response.
Assuming independent uncertainties, σRH/|RH| = √[(σt/t)² + (σm/m)²]. The inverse relationship gives carrier density the same fractional uncertainty. Thickness uncertainty alone contributes 5%.
Comparison and interpretation
The 300 K trace contains more scatter than the 250 K trace. The presentation reports a slightly smaller slope magnitude at the higher temperature and agreement with the expected order of magnitude. Neither plot alone isolates temperature as the cause of every difference.
Measurement limits
Geometry, contact misalignment, polycrystalline material, and regression uncertainty affect the interpretation. The archive does not provide a machine-readable raw sweep suitable for refitting here, so the original plots are retained. The proposed zinc comparison is future work, not a completed second-material result.
Read the source
Technical records.
About the evidence
Hall Effect — Measurement in Copper, project presentation. The Quantum Design procedure was consulted as reference material; its example images and results are not presented as personal work.
Continue exploring.
← Back to Selected Builds