Selected work · 07
Graphene Characterization
Connect device fabrication to electrical response across a set of graphene devices.
Explore the engineering ↓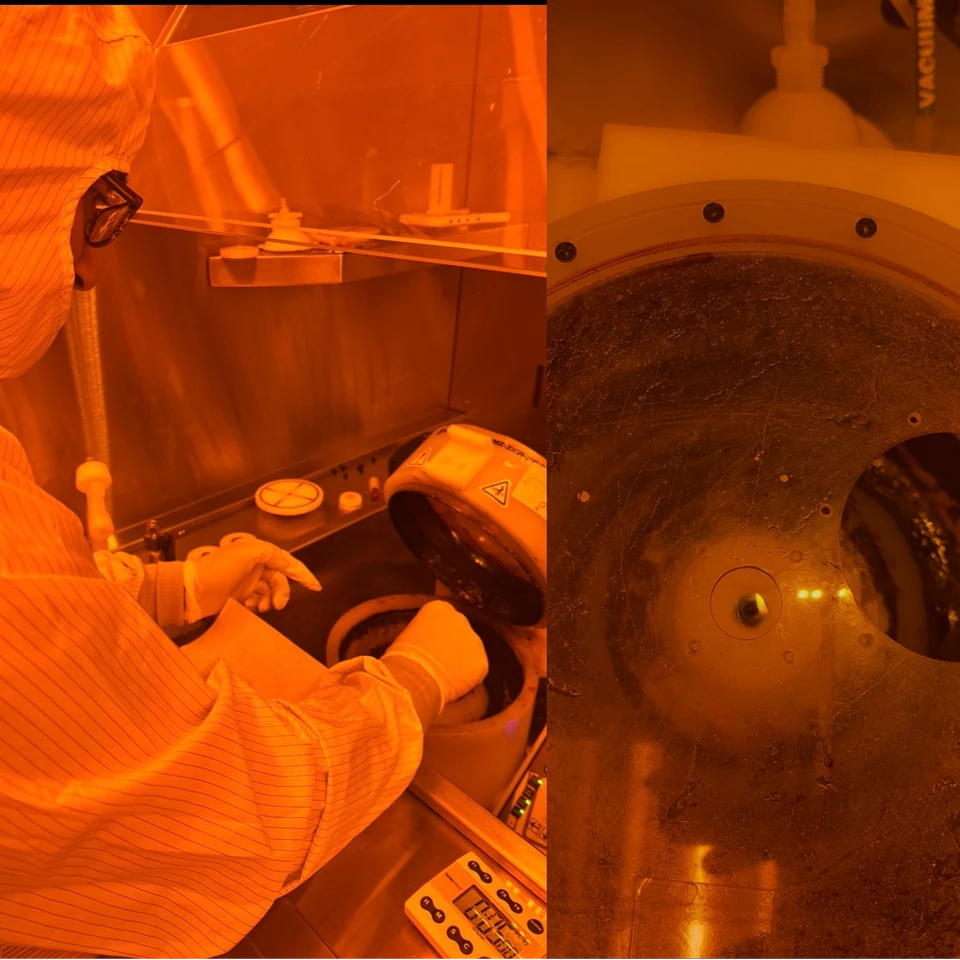
- My role
- Joint fabrication and characterization work with Hunter
- Status
- 20-device response documented
- Focus
- Lithography · wire bonding · transport
Result & scope
The presentation shows resistance–gate-voltage curves for 20 devices with peaks near 1.05 V. Similar peak position does not imply identical resistance or proven manufacturing yield.
- 01
Pattern
Spin-coat, expose, and develop the device pattern.
- 02
Connect
Wire-bond the chip into the measurement assembly.
- 03
Sweep
Apply the gate sweep and record electrical response.
- 04
Compare
Inspect peak position, amplitude, and device-to-device variation.
Evidence from the project
Inside the work.
Fabrication photograph from the joint project presentation.
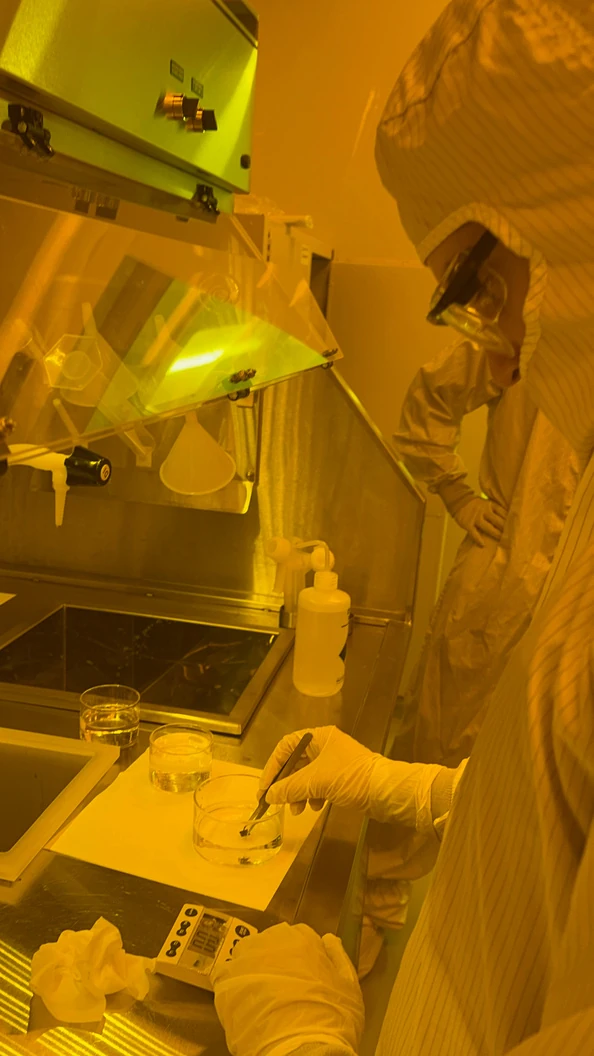
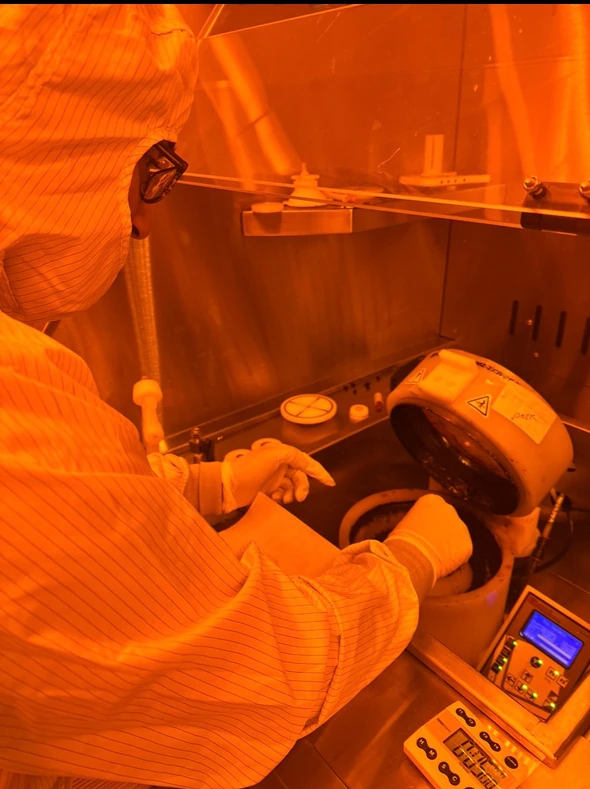
The source documents the lithography stage before electrical connection.
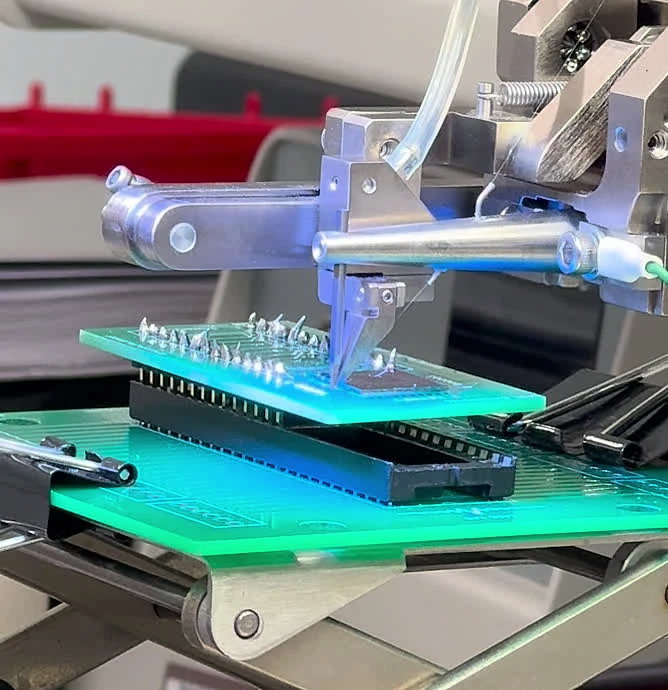
Electrical contacts connect the fabricated chip to its test assembly.
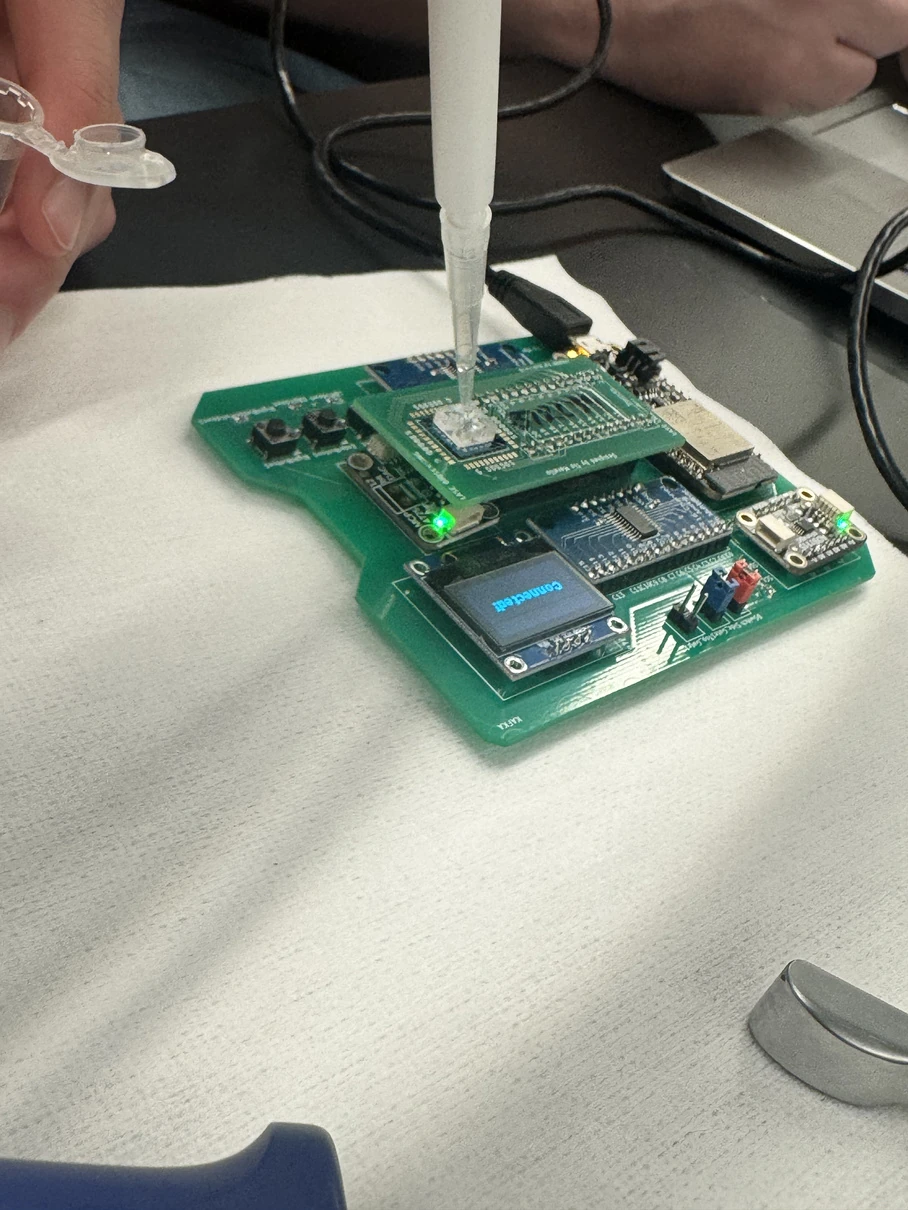
Sample handling and solution application before the gate-voltage measurement.
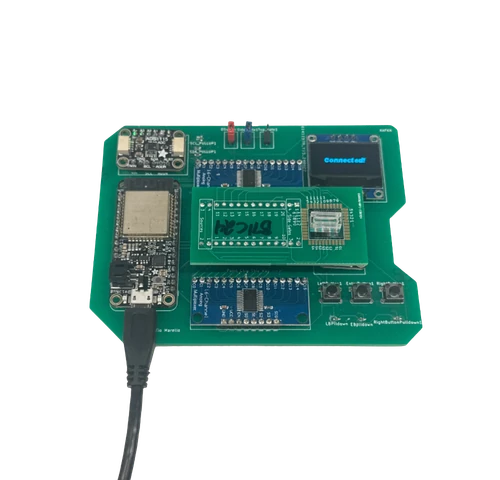
The board provides the physical connection between the device and acquisition setup.
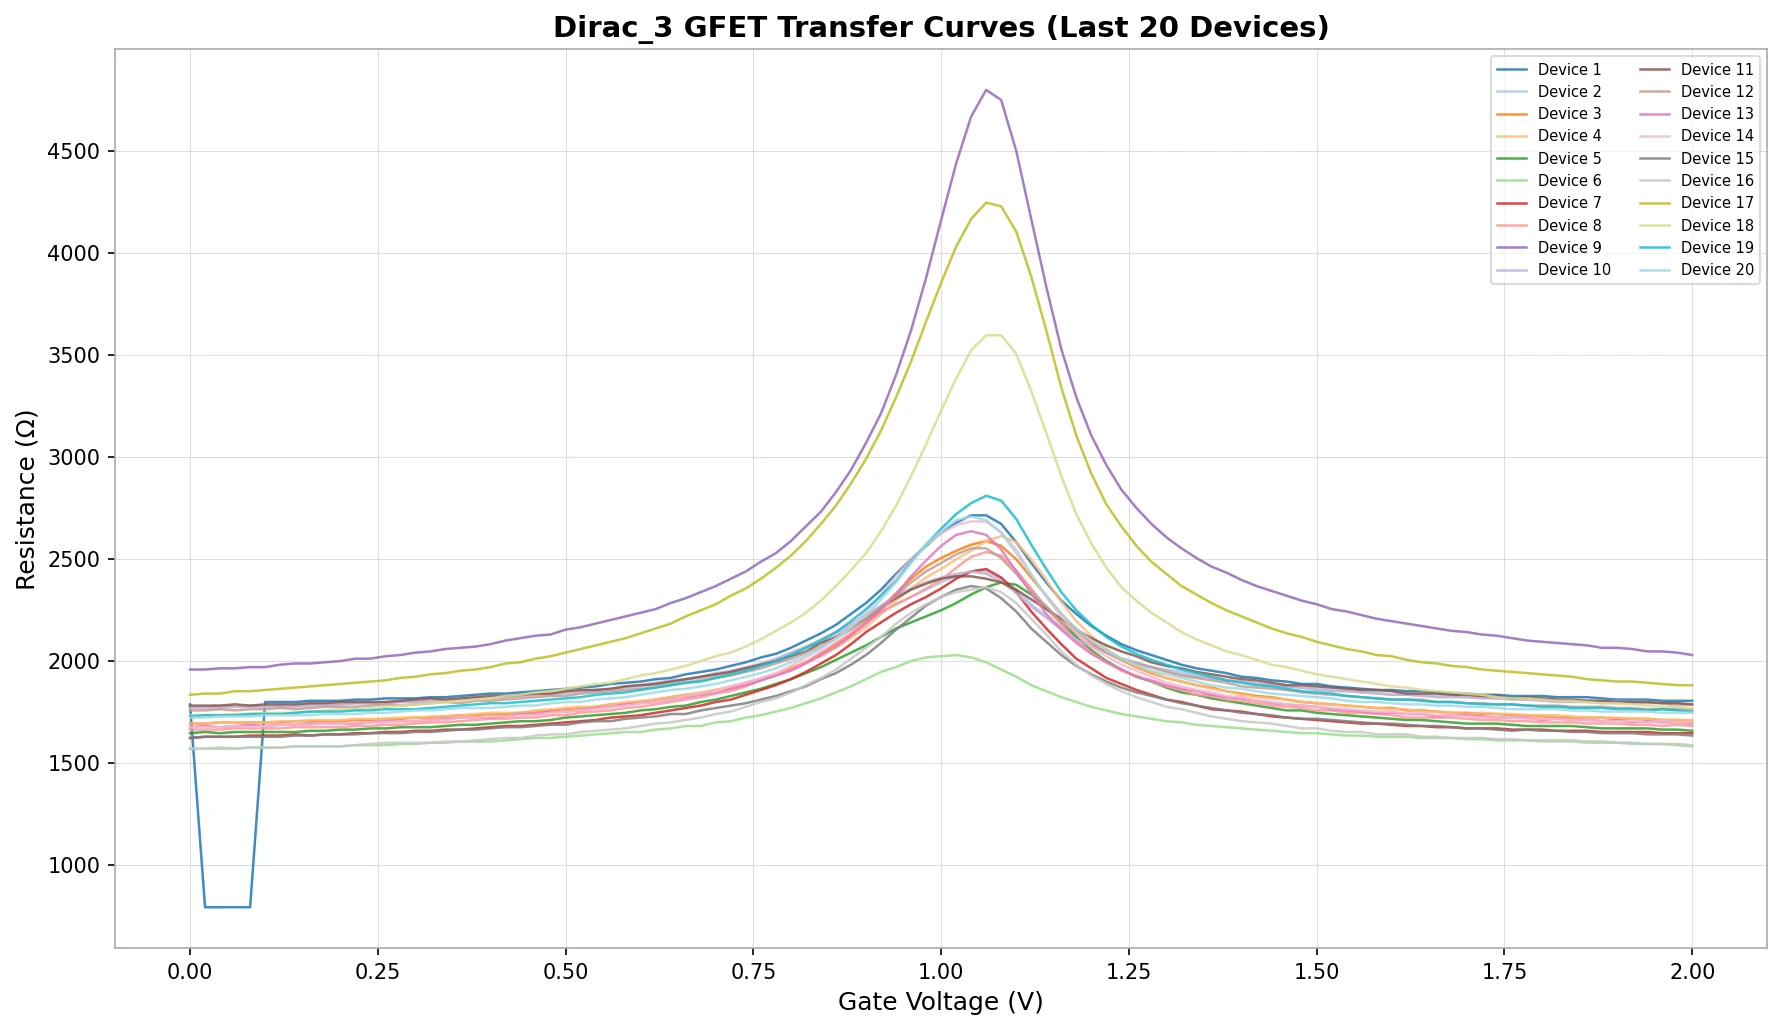
Original resistance–gate-voltage plot. Similar peak locations coexist with different response amplitudes.
Fabrication to measurement
The project presentation documents spin coating, hot-plate steps, uMLA exposure, development, microscopy, and wire bonding before electrical measurement. The photos link those steps to physical equipment and the mounted device.
The measurement setup
The notes describe applying diluted PBS solution and sweeping gate voltage, then repeating with a finer increment. The page preserves the source curves and labels rather than inferring new values from a screenshot.
What the curves support
Resistance rises toward a peak near charge neutrality and falls on the other side. The presentation identifies the peak around 1.05 V. Comparing all curves shows shared peak location alongside substantial differences in amplitude.
That is evidence of similar gate response, not enough by itself to prove uniform fabrication. Contact resistance, geometry, electrolyte conditions, and repeatability would need separate controls to explain the spread.
Uncertainty and the next measurement
The archive does not include the raw sweep table, repeat measurements, or a complete uncertainty budget. I have therefore kept the original plot and omitted a new fit, confidence interval, or device-yield statistic. The slide’s transconductance statement is also omitted because its reported units require clarification.
Read the source
Technical records.
About the evidence
Experiments in Physics I, joint Hunter and Veda presentation: fabrication, wire bonding, gate sweep, and 20-device comparison. Original plot retained; no new fit.
Continue exploring.
← Back to Selected Builds